
![]()

h-x Diagram Components

h-x diagram depiction of an adiabatic humidification process

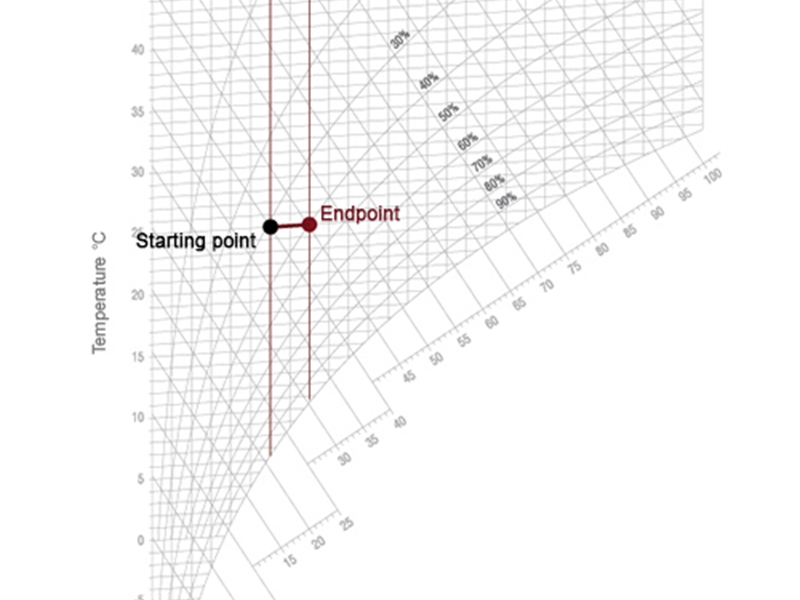
h-x diagram depiction of an isothermal humidification process

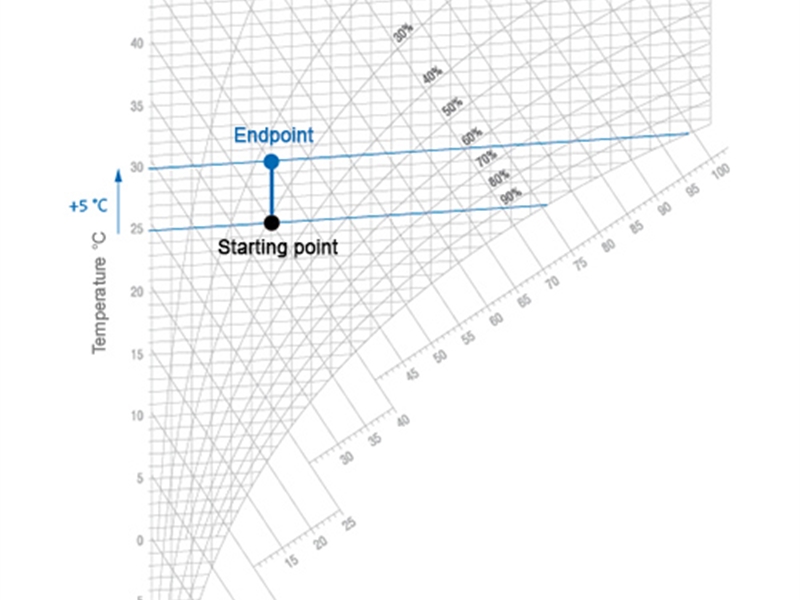
h-x diagram depiction of a temperature increase
Humidification Made Simple:
What is a h-x diagram?
Components and parameters:
An h-x diagram specifies all parameters required to describe air conditions:
| Temperature | = t | in °C |
| Absolute humidity | = x | in g/kg |
| Relative humidity | = RH | in % |
| Specific enthalpy | = h | in kJ(1+x)kg |
| Density | = p | in (kg/m3) |
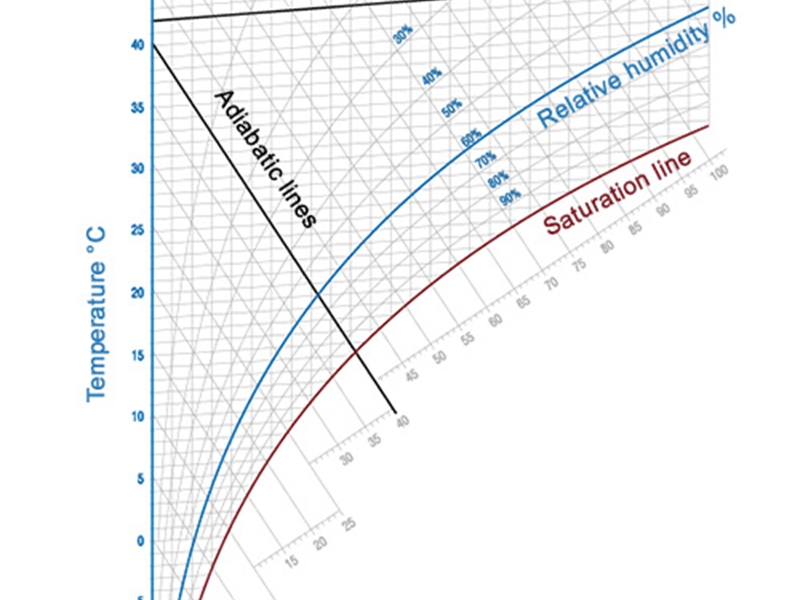
Layout
An h-x diagram is plotted as a skew coordinate system. The skew coordinate system was selected because it increases accuracy for reading the unsaturated range of moist air. To construct the skew diagram proposed by Mollier, the x-axis is rotated clockwise until the isotherm t = 0°C runs horizontal in the unsaturated range of moist air. The lines for constant specific enthalpy h run from the upper left to the lower right. The lines for constant water content x run vertically.
For practical reasons, the horizontal axis on which water content x is applied does not run through the coordinate system's point of origin. The partial pressure of the water vapor can be specified as a second x-axis since this value is only based on water content x and air pressure p. Specific enthalpy h is applied on lines which run diagonally. Arrays of curves are specified in the diagram for air temperature, density of moist air and relative humidity.
Use of a ruler allows for easy graphical depiction of condition changes, such as a condition change which occurs upon steam humidification. The index 1+x indicates that the enthalpy of moist air consists of the enthalpy of dry air and enthalpy of water. Lines of equal temperature (isotherms) rise slightly in the region of unsaturated air, namely around the portion of steam where enthalpy can be detected. The lines bend down at the saturation point (relative humidity = 1) since air can still hold water in liquid form as small drops of water (mist) in addition to the maximum amount of water vapor possible. The isotherms in the mist region deviate from the lines for constant enthalpy which run through the saturation point by only the slightly perceptible enthalpy for the additional amount of water.
There are now curves of equal relative humidity in the region of unsaturated air which are produced through the even division of the isotherm sections between = 0 and = 1. Relative humidity therefore becomes smaller and smaller as air becomes warmer, assuming the water content x does not change.
Calculations Using the h-x Diagram
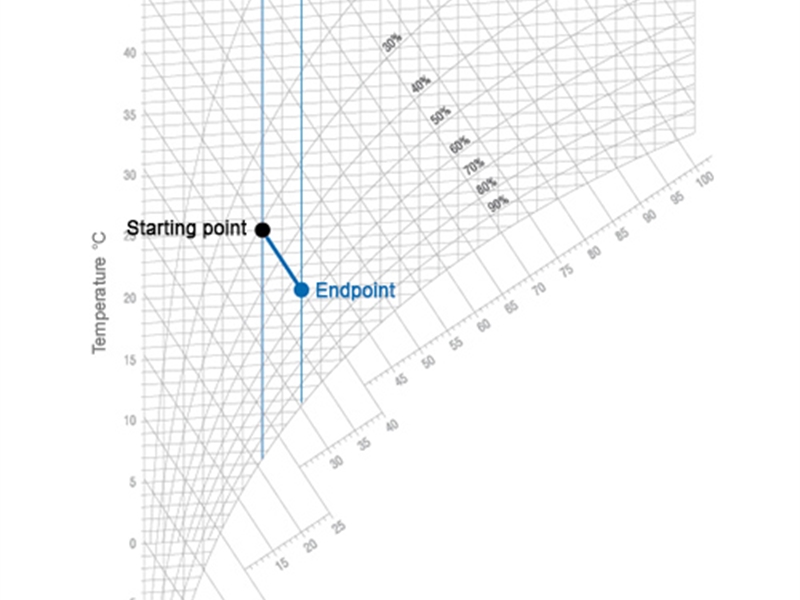
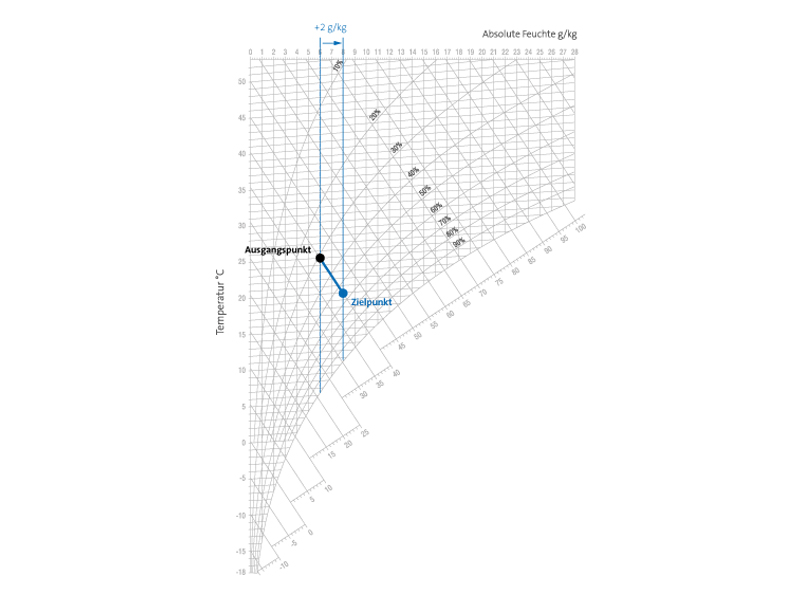
Warming at Constant Absolute Humidity
The adjacent figure depicts the warming process for an air mass which experiences no changes in its steam content. What can we infer from this process?
Heating begins at 11°C (point 1) and ends at 25°C (point 2). The absolute humidity x in this process remains constant, at 4 g/kg. On the other hand, relative humidity changes from 50% at 11°C to 20% at 25°C. Enthalpy h (1+x) also changes from 21.4 kJ/kg to 35 kJ/kg, as well as density, which experiences a change from 1.24kg/m3 to 1.17 kg/m3.
Atomization and Evaporation of Water (Adiabatic Humidification)
If water is atomized or evaporated without the addition of extra heat, the energy required for the evaporation process is drawn from the surrounding air. As a result, the air cools down. This process is called adiabatic cooling since the cooling process runs in parallel to the adiabatic process. The ruler ∆h/∆x in the h-x diagram shows the precise direction of the cooling curve during humidification.
Calculation of ∆h/∆x:
| ∆h | = | kJ/kg |
| ∆x | kg H2O / kg dry air |
Humidification using Steam (Isothermal Humidification)
Temperature essentially remains constant when steam is used for humidification,
since the water vapor is at the same energy level as the air.
Calculation of ∆h/∆x:
| ∆h | = | kJ/kg |
| ∆x | kg dry air |